When it comes to API testing, you may have wondered some or all of these questions:
-
How will my APIs perform in real-world situations?
-
How will the response times change when multiple users are sending requests at the same time?
-
Will my users see acceptable response times when my system is under load, or will they see errors?
-
How can I identify performance bottlenecks that may become major production issues?
If so, you’ve likely realized that as you scale, your API’s performance impacts the success of your products and business.
To address the above concerns, we recently launched early access to Postman’s exciting new API performance testing feature. Read more about the what and why behind this game-changing update to the Postman API Platform in this early access blog post.
Today, we are excited to announce the general availability of API performance testing with Postman.
Introducing API performance testing in Postman from your machine
API performance testing involves simulating real-world traffic and observing your API’s resulting behavior. It is conducted to evaluate how well an API meets performance expectations for response time, throughput, and availability under the simulated load.
API performance testing can help you:
-
Ensure your API can handle the expected load and check how the API responds to changes in load (load is the number of parallel users hitting your APIs at the same time).
-
Optimize and improve the API’s performance to ensure a better user experience.
-
Identify any bottlenecks, latency, and failures and determine the scalability of the system.
Postman now has built-in capabilities for testing your API’s performance with your existing Postman Collections and requests. There are two core functionalities we will discuss in this post:
-
Using Postman to simulate load by having multiple parallel virtual users hit your endpoints.
-
Visualizing the performance of your APIs under the simulated load in real time. We will show you how to observe response times, throughput (requests hit per second), and error rates so you can keep tabs on your API performance metrics.
How to use Postman for API performance testing
You can use Postman’s Collection Runner to set up a performance test in Postman by following these steps:
Step 1: Select a collection, select an environment (optional), and click Run:
If you do not have a collection, read more about how you can quickly create one in Postman.
Please note that Postman will also execute all of your pre-request and test scripts along with the requests.
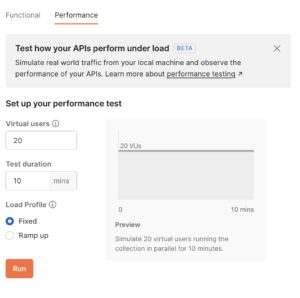
Step 2: Select the Performance tab under Runner, specify the load settings, and click Run:
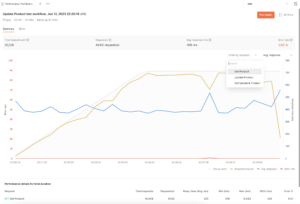
Step 3: Observe the response times and error rate in real time:
You can toggle on the legend to view requests per second as well.
Step 4: Once the run is completed, observe and identify bottlenecks in response times and requests per second:
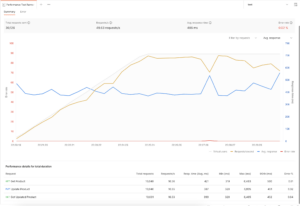
How to configure the load to simulate real-world traffic
You can now use the Collection Runner to simulate real-world traffic. You will be able to specify the following inputs to simulate the load condition:
-
Virtual users (VUs): The maximum number of parallel users you want to simulate.
-
Test duration: The amount of time (in minutes) for which you want to run the test.
-
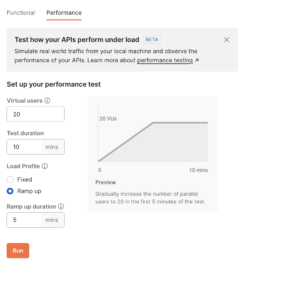
Load profile: The intensity of the load during the test’s duration. We currently support two load profiles:
-
“Fixed” load profile: This will apply a fixed number of virtual users throughout the test duration:
-
“Ramp up” load profile: This will slowly increase the number of virtual users during the “ramp up duration” to reach the specified load. Once reached, this number of virtual users will be maintained for the remaining duration:
-
How virtual users help you simulate load on your API workflows
Virtual users are the parallel users that will hit your APIs at the same time. Each virtual user executes the selected sequence of requests in the collection in serial order as represented on the Collection Runner. Multiple virtual users will run this sequence in parallel, creating a load for your API workflows. For example, a login request that’s followed by an add-to-cart request and a checkout request represents a workflow, and each virtual user will run through this workflow. If you wish to test your APIs in isolation, we suggest that you test a single request at a time.
Please note that since the virtual users are being simulated locally, there is a limit to the numbers you can simulate without running into memory or other issues. Learn more by reading our Learning Center documentation.
We are offering up to 100 free virtual users on our free plan. You can choose to upgrade to a paid plan for testing with a higher number of virtual users.
The ultimate objective of API performance testing is to ensure that your end users get a good experience when consuming your shipped APIs. Therefore, the type of traffic you choose to simulate during testing will depend on the kind of situations you expect your APIs to handle in the production environment.
Visualizing the metrics of a performance test
As soon as the performance test starts, you will be able to visualize and observe the performance of your APIs. Postman will show the following metrics in real time:
-
Average response time: This is the average of the response times received for the multiple parallel virtual users across the various requests.
-
Requests per second: The requests per second (throughput) metric helps you observe how many requests can be served by your API per second. Each virtual user is continuously hitting your endpoints, and depending on the response times, each virtual user can send multiple requests in a second. For example, setting up 10 virtual users to test a GET request that you expect to respond in ~200ms might produce 50 requests per second at best. However, the realistic number of request hits per second will depend on your API’s response time and other various factors, such as the use of pre-request or test scripts.
-
Error rate: This metric indicates the fraction of the requests that get a non-2XX response or face non-HTTP errors while sending the request.
Note that all of the above metrics are commutative across all your selected requests. Postman aggregates your metrics in short-term intervals. Subsequent metrics from consecutive time intervals are placed together, helping you visualize the changes to these metrics over time.
Troubleshooting errors in your performance test runs
When your performance tests indicate elevated error rates and you would like to know more, you can simply hover over the point of interest and see what’s causing the spike. This helps you identify the cause of the error and troubleshoot the problem further, as shown below:
Once the run is complete, you can also click on the Errors tab to view the detailed error rate breakdown trend:
We’d like to give a big shout-out to our enthusiastic community of early adopters, who tried the product in our canary release and gave us feedback that led to this improvement!
Drill down into your metrics by request
Request drill down lets you drill down into every request that has been executed by the many virtual users. This helps you identify which request could have contributed to a spike in the commutative average response times, enabling you to fix the problem.
You can also visualize the performance metrics of individual requests by selecting the required request in the available filter:
Viewing past performance test runs
You can view the list of past performance test runs for a collection, as shown below:
We hope that with this new feature, you find it easier to test your API’s performance and make API performance testing part of your development lifecycles. Our goal at Postman is to democratize API performance testing for all the API developers and testers in the world, just as we did for API functional testing a few years ago.
You can learn more about API performance testing in our Learning Center. We are providing up to 25 performance test runs for free on a monthly basis in our free plan! You can upgrade to a paid plan for higher usage. Learn more about our different plans here.
You can schedule a time with a product manager to learn more about this feature or discuss your feedback in detail.