Our whole team is currently working hard on the next version of Flare. We're completely redesigning the application and website, and it is an immense effort, but it will undoubtedly pay off in the future.
In this rewrite of Flare, we decided to move from Laravel resources to our own Laravel data package for sending data to the front end. Doing this not only adds the benefit of a fully typed response, but we also get TypeScript definitions for our resources without extra effort.
Once all resources were manually converted into data objects, we were excited to check if everything worked fine. Though we didn't hit on any exceptions or errors, some application pages felt extremely slow, too slow to be useful for our clients.
We quickly found that much of the response time was spent on the data objects. We started by optimizing the data objects using the lazy functionality, which allows loading certain parts of the data later on when the initial page is already sent. It made the pages faster, but we didn't want to stop there since we're completely redesigning the whole application.
The laravel-data package is fantastic to work with, but it also adds a lot of complexity when outputting data. In this blog post, we will look at how we've improved the performance of the package and, thus, the complete Flare application.
To get started, I will introduce you to three tools you can use within your toolset to research performance problems: Xdebug, PHPBench, and QCacheGrind.
Xdebug is a PHP extension that provides debugging and profiling capabilities. It is most famous for its complicated configuration, which may slow down your whole application. Luckily, Xdebug version 3 made extensive progress on this part, and setting up Xdebug is now relatively easy.
PHPBench is a benchmarking tool for PHP that can help you measure the performance of your code. It allows you to create test cases and run them multiple times to get a notion of the speed of your code.
Lastly, QCacheGrind is an application allowing you to look at the profiles generated by Xdebug visually. QCacheGrind is available for MacOS and Windows. If you're on Linux, look at KCachegrind, which is almost the same.
Getting a baseline
To start, we need to be able to test if the changes we make to our code have a positive or negative impact on the performance. The best way to do this is by creating a few benchmarks using PHPBench. These benchmarks will be run multiple times, and the average time this take can be used as a metric to see if we've made a difference by updating the code.
PHPBench works a lot like PHPUnit. You create a few benchmark files (like tests) with benchmark cases (like test cases). The PHPBench command will then execute these files like the PHPUnit command would. Only it executes the cases multiple times and tracks how long it takes.
We get started as usual by installing PHPBench:
composer require phpbench/phpbench --dev
Next, we create a phpbench.json file which configures PHPbench:
{
     "$schema":"./vendor/phpbench/phpbench/phpbench.schema.json",
     "runner.bootstrap": "vendor/autoload.php",
     "runner.path" : "benchmarks"
 }
The runner.path option defines the directory where our benchmarks are located, so we create a new directory for them:
mkdir benchmarks
The last thing to do is create the benchmark. We call this file ExampleBench.php. Notice the Bench suffix. Using this suffix is essential because, otherwise, PHPBench won't execute the file. Within the ExampleBench.php, we add an ExampleBench class:
class ExampleBench
{

}
Let's create a first benchmark:
use PhpBench\Attributes\Iterations;
use PhpBench\Attributes\Revs;

class ExampleBench
{
    #[Revs(500), Iterations(5)]
    public function benchPow()
    {
		pow(2, 10);
    }
}
As you can see, we will benchmark how long it takes to calculate 2^10. The benchmark case we've added is called benchPow. Notice the bench keyword prefixed, which is required for PHPBench to find the benchmark case.
We've also added two attributes to the method:
Revs, short for revolutions, refers to the number of times the benchmark is executed consecutively within a single time measurement. The more revolutions, the more accurate the result. In this case, we will calculate 2^10 a whopping 500 times!
In an ideal world, we're done and can start measuring. But running these revolutions multiple times is safer and more correct to ensure our measurements are stable and don't differ too much.
We have five iterations of 500 revolutions so that the pow function will be executed for 5 * 500 = 2500 times.
Now it is time to run PHPBench:
vendor/bin/phpbench run --report=default
And we get the following result:
PHPBench (1.2.9) running benchmarks... #standwithukraine
with configuration file: /Users/ruben/Spatie/laravel-data/phpbench.json
with PHP version 8.2.3, xdebug ✔, opcache ❌

\ExampleBench

    benchPow................................I4 - Mo0.038μs (±3.33%)

Subjects: 1, Assertions: 0, Failures: 0, Errors: 0
+------+--------------+----------+-----+------+------------+----------+--------------+----------------+
| iter | benchmark    | subject  | set | revs | mem_peak   | time_avg | comp_z_value | comp_deviation |
+------+--------------+----------+-----+------+------------+----------+--------------+----------------+
| 0    | ExampleBench | benchPow |     | 500  | 1,812,376b | 0.036μs  | -1.58σ       | -5.26%         |
| 1    | ExampleBench | benchPow |     | 500  | 1,812,376b | 0.038μs  | +0.00σ       | +0.00%         |
| 2    | ExampleBench | benchPow |     | 500  | 1,812,376b | 0.038μs  | +0.00σ       | +0.00%         |
| 3    | ExampleBench | benchPow |     | 500  | 1,812,376b | 0.038μs  | +0.00σ       | +0.00%         |
| 4    | ExampleBench | benchPow |     | 500  | 1,812,376b | 0.040μs  | +1.58σ       | +5.26%         |
+------+--------------+----------+-----+------+------------+----------+--------------+----------------+
It looks like 0.038μs is the best average we have. Let's see what's the fastest:
- 2^20
- 2^10 * 2^10
Our benchmark now will look like this:
class ExampleBench
{
    #[Revs(500), Iterations(5)]
    public function benchPow()
    {
        pow(2, 20);
    }

    #[Revs(500), Iterations(5)]
    public function benchPowPow()
    {
        pow(2, 10) * pow(2, 10);
    }
}
Running PHPBench gives the following results:
PHPBench (1.2.9) running benchmarks... #standwithukraine
with configuration file: /Users/ruben/Spatie/laravel-data/phpbench.json
with PHP version 8.2.3, xdebug ✔, opcache ❌

\ExampleBench

    benchPow................................I4 - Mo0.039μs (±3.78%)
    benchPowPow.............................I4 - Mo0.060μs (±11.25%)

Subjects: 2, Assertions: 0, Failures: 0, Errors: 0
+------+--------------+-------------+-----+------+------------+----------+--------------+----------------+
| iter | benchmark    | subject     | set | revs | mem_peak   | time_avg | comp_z_value | comp_deviation |
+------+--------------+-------------+-----+------+------------+----------+--------------+----------------+
| 0    | ExampleBench | benchPow    |     | 500  | 1,812,376b | 0.040μs  | +0.27σ       | +1.01%         |
| 1    | ExampleBench | benchPow    |     | 500  | 1,812,376b | 0.042μs  | +1.60σ       | +6.06%         |
| 2    | ExampleBench | benchPow    |     | 500  | 1,812,376b | 0.038μs  | -1.07σ       | -4.04%         |
| 3    | ExampleBench | benchPow    |     | 500  | 1,812,376b | 0.038μs  | -1.07σ       | -4.04%         |
| 4    | ExampleBench | benchPow    |     | 500  | 1,812,376b | 0.040μs  | +0.27σ       | +1.01%         |
| 0    | ExampleBench | benchPowPow |     | 500  | 1,812,376b | 0.076μs  | +1.47σ       | +16.56%        |
| 1    | ExampleBench | benchPowPow |     | 500  | 1,812,376b | 0.072μs  | +0.93σ       | +10.43%        |
| 2    | ExampleBench | benchPowPow |     | 500  | 1,812,376b | 0.060μs  | -0.71σ       | -7.98%         |
| 3    | ExampleBench | benchPowPow |     | 500  | 1,812,376b | 0.060μs  | -0.71σ       | -7.98%         |
| 4    | ExampleBench | benchPowPow |     | 500  | 1,812,376b | 0.058μs  | -0.98σ       | -11.04%        |
+------+--------------+-------------+-----+------+------------+----------+--------------+----------------+
So basically, it costs 50% more time to calculate two pow(2, 10) functions than one pow(2, 20), that's quite useful!
Now back to laravel-data, we want to know how fast we can create a data object and how fast we can transform it into a JSON object. We can describe this as follows:
class DataBench
{
	#[Revs(500), Iterations(2)]
    public function benchDataCreation()
    {
        MultiNestedData::from([
            'nested' => ['simple' => 'Hello'],
            'nestedCollection' => [
                ['simple' => 'Flare'],
                ['simple' => 'is'],
                ['simple' => 'awesome'],
            ],
        ]);
    }

    #[Revs(500), Iterations(2)]
    public function benchDataTransformation()
    {
        $data = new MultiNestedData(
            new NestedData(new SimpleData('Hello')),
            new DataCollection(NestedData::class, [
                new NestedData(new SimpleData('Flare')),
                new NestedData(new SimpleData('is')),
                new NestedData(new SimpleData('awesome')),
            ])
        );

        $data->toArray();
    }

    #[Revs(500), Iterations(2)]
    public function benchDataCollectionCreation()
    {
        $collection = Collection::times(
            15,
            fn() => [
                'nested' => ['simple' => 'Hello'],
                'nestedCollection' => [
                    ['simple' => 'Flare'],
                    ['simple' => 'is'],
                    ['simple' => 'awesome'],
                ],
            ]
        )->all();

        MultiNestedData::collection($collection);
    }

    #[Revs(500), Iterations(2)]
    public function benchDataCollectionTransformation()
    {
        $collection = Collection::times(
            15,
            fn() => new MultiNestedData(
                new NestedData(new SimpleData('Hello')),
                new DataCollection(NestedData::class, [
                    new NestedData(new SimpleData('Flare')),
                    new NestedData(new SimpleData('is')),
                    new NestedData(new SimpleData('awesome')),
                ])
            )
        )->all();

        $collection = MultiNestedData::collection($collection);

        $collection->toArray();
    }
}
In the first benchmark, we're creating a data object using arrays. In the second one, we created an object as efficiently as possible by manually defining it and then transforming it to JSON.
We also added two cases where we do the same, but instead of using data objects, we benchmark using data collections of multiple data objects.
Now running PHPBench will fail because the laravel-data package depends on some Laravel functionality. Luckily Laravel provides excellent testing infrastructure, which we can use within our benchmark. We do this by using the CreatesApplication trait, which is also present in the base Laravel test case:
use Tests\CreatesApplication;

class DataBench
{
    use CreatesApplication;

    public function __construct()
    {
        $this->createApplication();
    }

    // The benchmarks
}
We need another update because we're benchmarking a laravel package, not a laravel application. This means we must use the CreatesApplication trait from the orchestra/testbench package, which is used to test Laravel packages. And we also need to specify the laravel-data service provider to boot up the package:
use Orchestra\Testbench\Concerns\CreatesApplication;

class DataBench
{
    use CreatesApplication;

    public function __construct()
    {
        $this->createApplication();
    }

    protected function getPackageProviders($app)
    {
        return [
            LaravelDataServiceProvider::class,
        ];
    }

    // The benchmarks
}
Great, we now have some benchmarks ready to measure the speed of our code!
Getting started with Xdebug
Next up, we need to profile our code. When we're profiling our code, we will run it a bit differently than like would typically. When profiling the PHP process will write down each function call we make and also keep track of how long it takes to run the function. Ultimately, all this information will be written into a file we can analyze.
To get this working, we need to install and enable Xdebug. You can find the instructions here.
For me, on a Mac, it was as simple as this:
sudo pecl install xdebug
We also need to update or create the Xdebug .ini file:
[xdebug]

xdebug.mode=profile
xdebug.start_with_request=yes
On my Mac, I've put this file here: nano /opt/homebrew/etc/php/8.2/conf.d/xdebug.ini.
We configure two options:
-
xdebug.mode=profileto enable profiling in Xdebug. -
xdebug.start_with_request=yesto start profiling with PHPBench. When you're done with profiling, don't forget to set this tooffortrigger. Otherwise, all your PHP applications will take ages to load.
We have our benchmarks, and we have our profiler. Now we only need to combine those two, and then we can discover why our code is so slow!
Profiling the code
We will rerun our benchmarks, but this time we will also profile the benchmarks. We can do this with the following command:
vendor/bin/phpbench xdebug:profile
Which gives the following output:
PHPBench (1.2.9) running benchmarks... #standwithukraine
with configuration file: /Users/ruben/Spatie/laravel-data/phpbench.json
with PHP version 8.2.3, xdebug ✔, opcache ❌

\DataBench

    benchDataCreation.......................I0 - Mo10.762ms (±0.00%)
    benchDataTransformation.................I0 - Mo1.095ms (±0.00%)
    benchDataCollectionCreation.............I0 - Mo159.879ms (±0.00%)
    benchDataCollectionTransformation.......I0 - Mo13.952ms (±0.00%)

Subjects: 4, Assertions: 0, Failures: 0, Errors: 0

4 profile(s) generated:

/Users/ruben/Spatie/laravel-data/.phpbench/xdebug-profile/3fcb020036c8d7e8efdcddd4dbd66b92.cachegrind.gz
/Users/ruben/Spatie/laravel-data/.phpbench/xdebug-profile/8deba1dcce573e1bf818772ac7a5ace0.cachegrind.gz
/Users/ruben/Spatie/laravel-data/.phpbench/xdebug-profile/06d049dacb2a7a3809e069c6c8289e02.cachegrind.gz
/Users/ruben/Spatie/laravel-data/.phpbench/xdebug-profile/41c9fe618b93431786fff90b1d624b82.cachegrind.gz
Running the benchmark suite now takes way longer than before. In the end, we have a new directory with our profiles:
- .phpbench/xdebug-profile/3fcb020036c8d7e8efdcddd4dbd66b92.cachegrind.gz
- .phpbench/xdebug-profile/8deba1dcce573e1bf818772ac7a5ace0.cachegrind.gz
- .phpbench/xdebug-profile/06d049dacb2a7a3809e069c6c8289e02.cachegrind.gz
- .phpbench/xdebug-profile/41c9fe618b93431786fff90b1d624b82.cachegrind.gz
Each file corresponds to a benchmark case within your benchmark suite. The best way to find out which file belongs to which benchmark is to look at the execution order of benchmark cases and match them with the files in the order they were created.
At the moment, all files are compressed. Let us decompress them:
gzip --decompress .phpbench/xdebug-profile/*
Analyzing
It is finally time to find out why our code is slow. This is also the most complicated step in the process, and there is no guide to quickly finding a bottleneck. You should have a good understanding of your code and be able to see strange behavior within profiles. Some things that might stand out:
- functions that shouldn't be executed
- functions that are executed too much
- functions that take longer than expected
Let's open a profile where we create a collection of data objects:
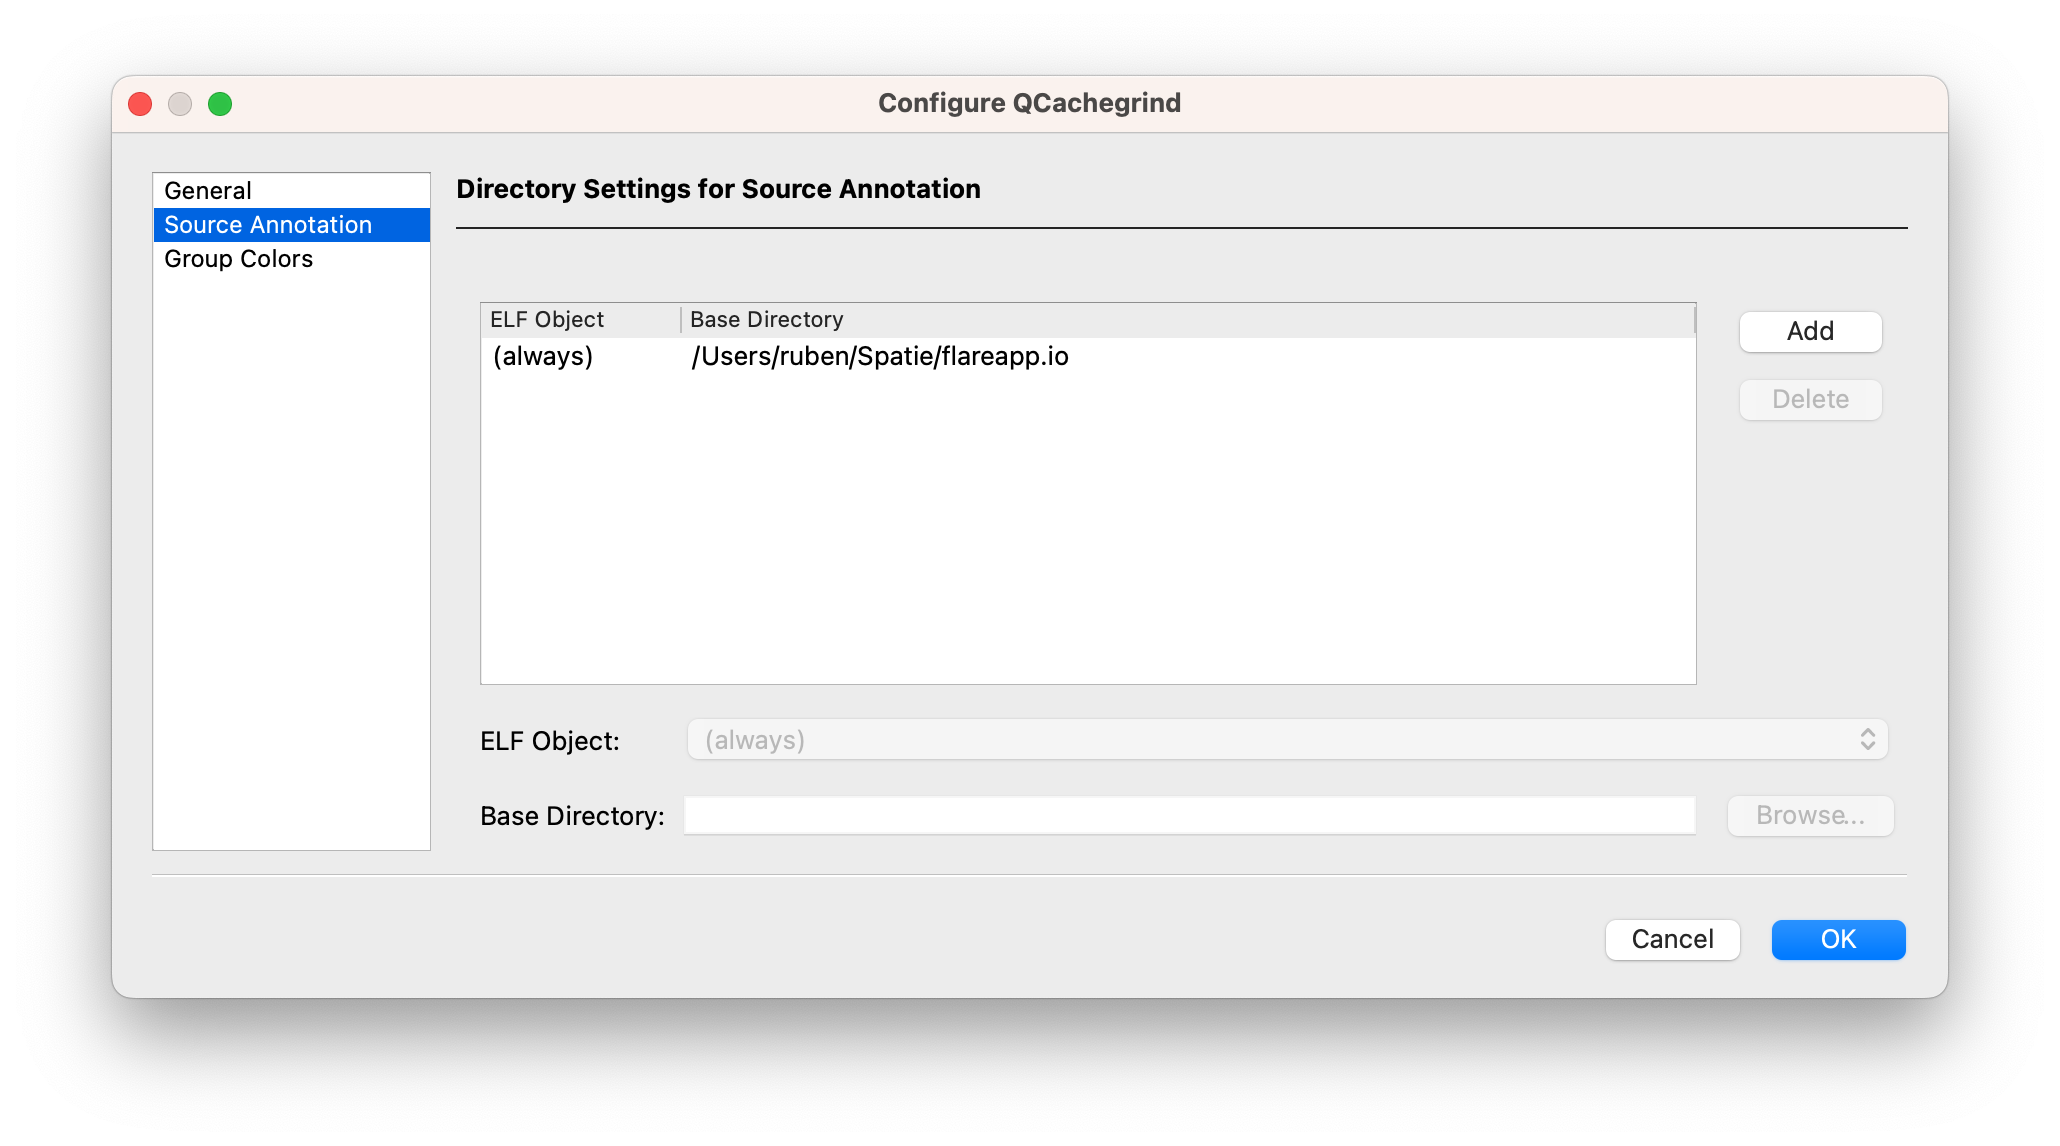
First, we're going to configure QCacheGrind a bit more. Go to:
QCacheGrind -> Preferences -> Source Annotations
And add the path where your code is situated. This allows QCacheGrind to give some hints with code examples of which code is slow.
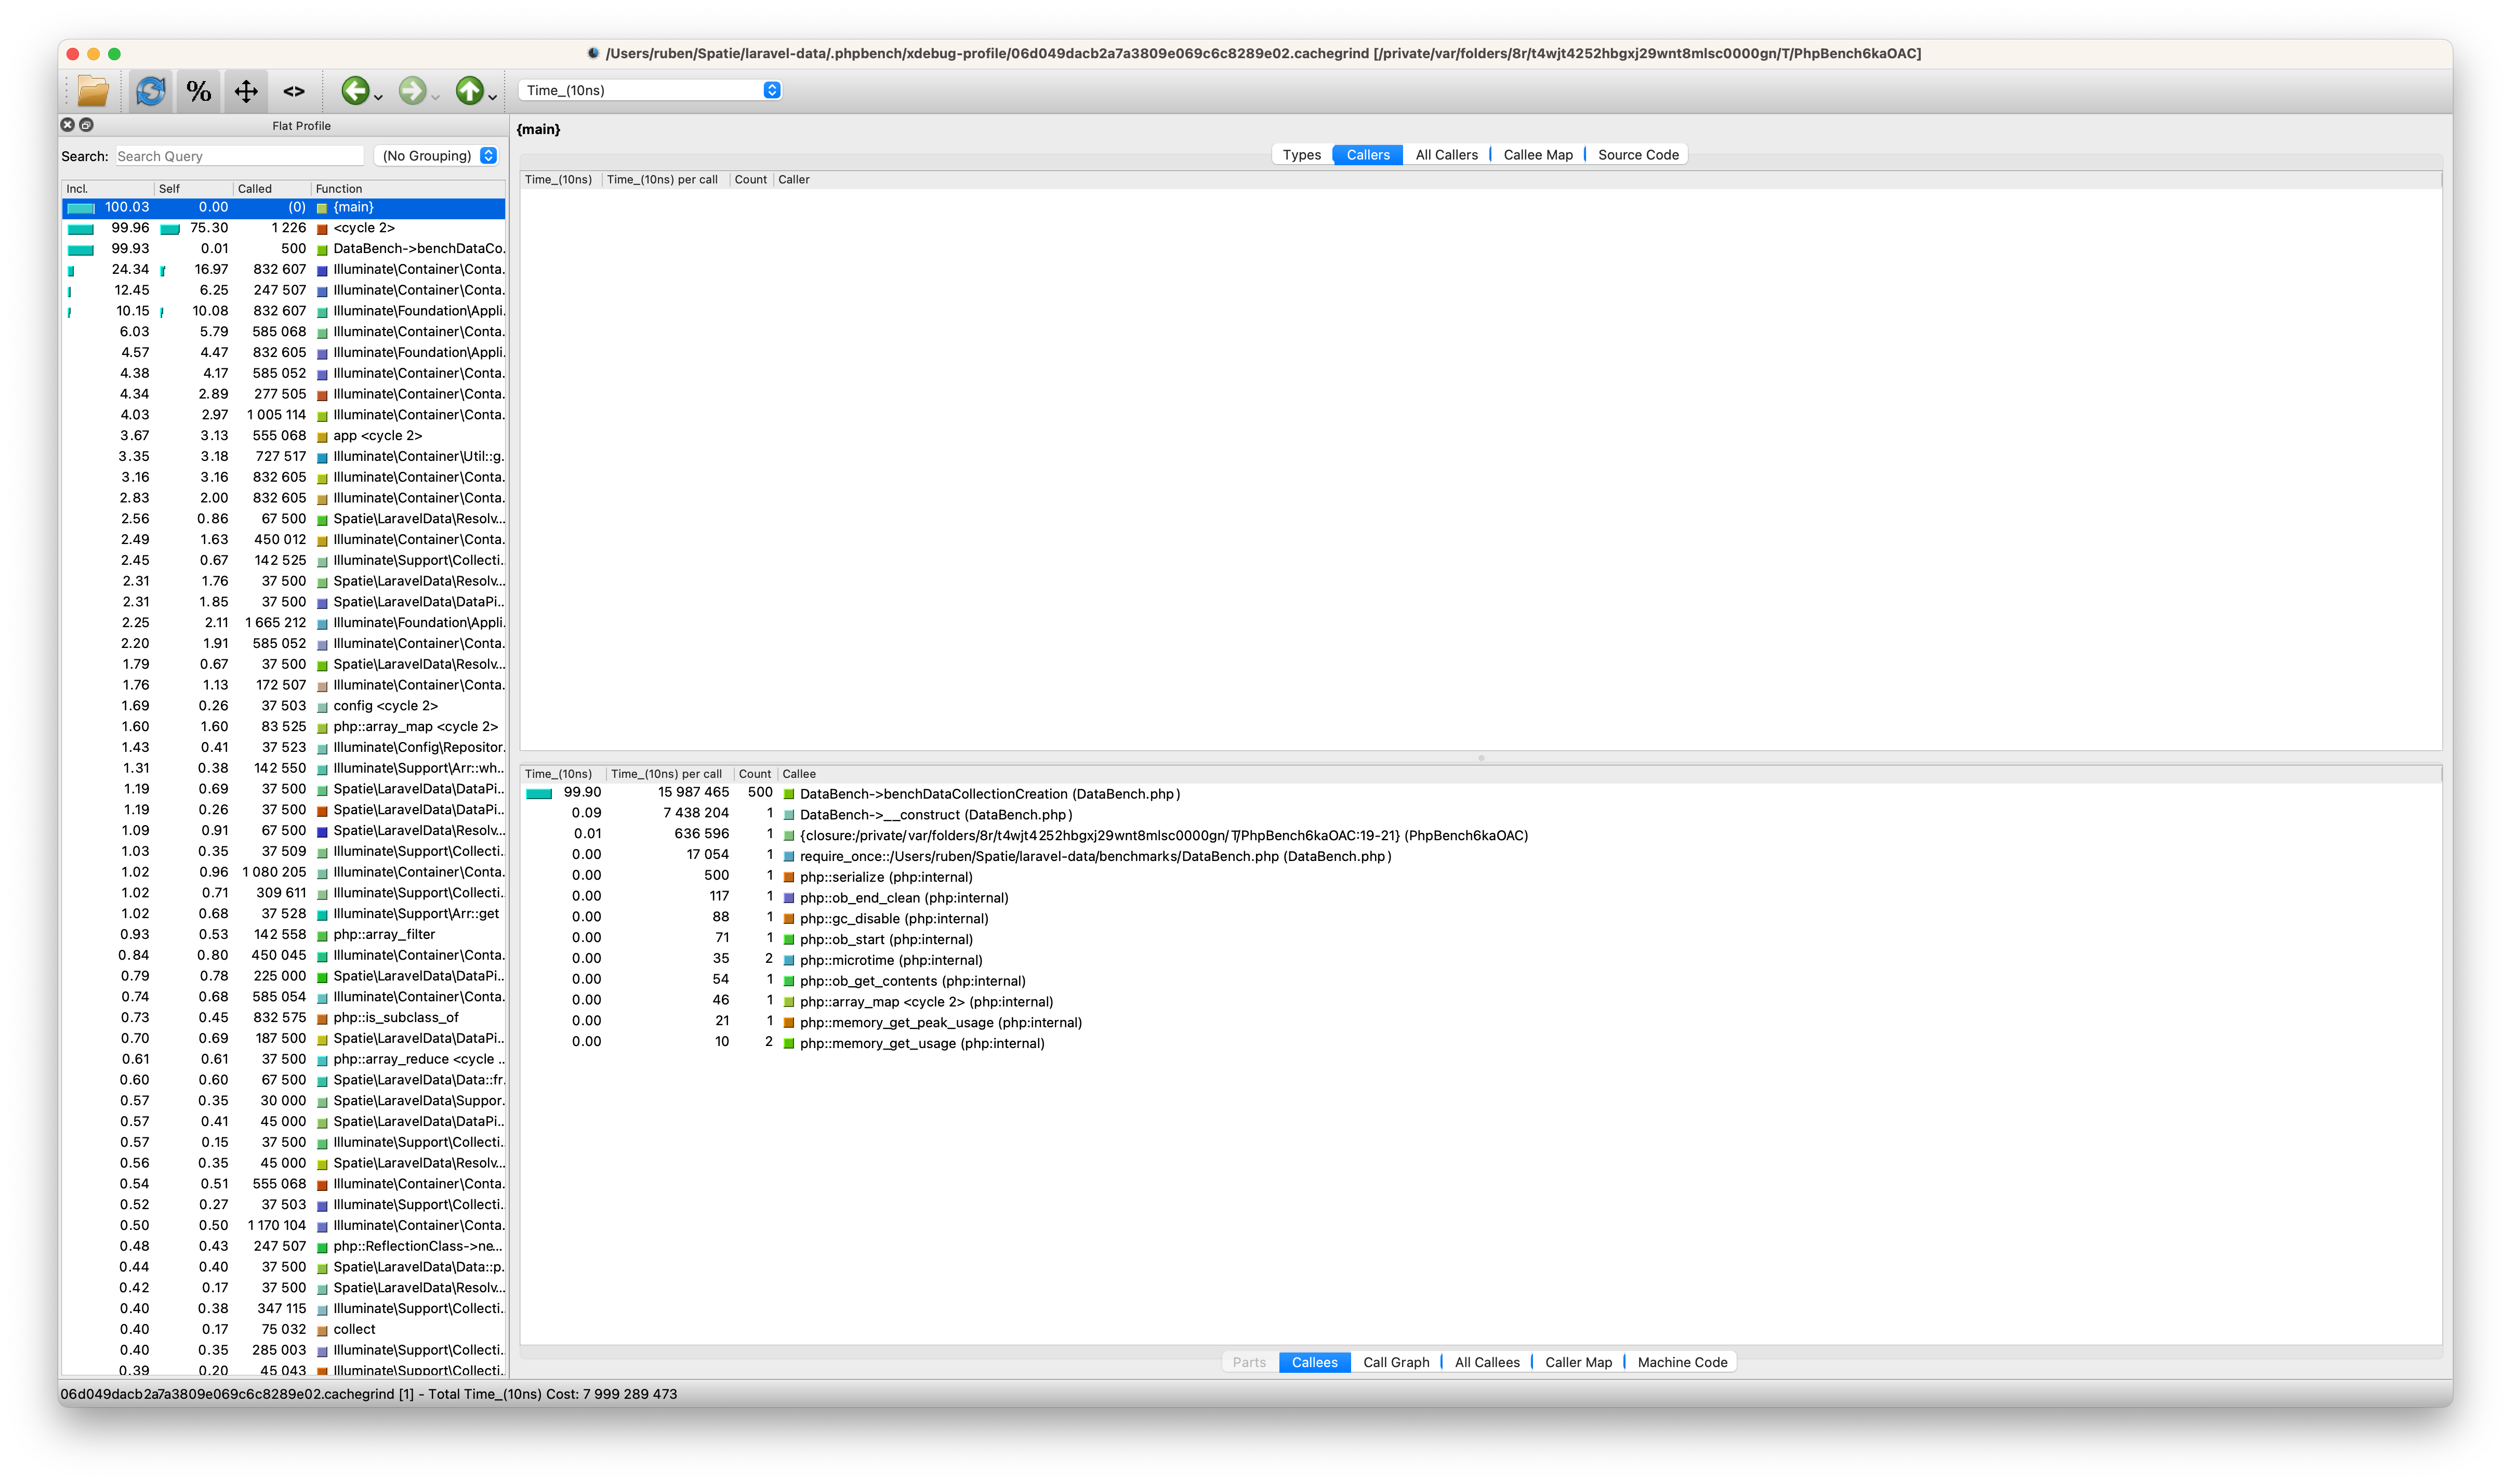
The application has three panels:
- On the left: the functions which were called sorted by the lengthiest call
- On the right-top: the callers of a selected function
- On the right-bottom: for a selected function, the functios called
On the left side, we see all the functions called. The Self metric shows how long it took to call a function, the Incl. metric shows how long the function and all the functions it called took. So the PHPBench function, for example, takes 99.93% of the time Incl. but it spends only 0.01% of the time within the function. All the other time is used to call other functions, our benchmarks with data creation.
Immediately we see something bizarre. We spend 24.34% of the time in Illuminate\Container\Container->resolve(). Let's click on that function and see what's happening:
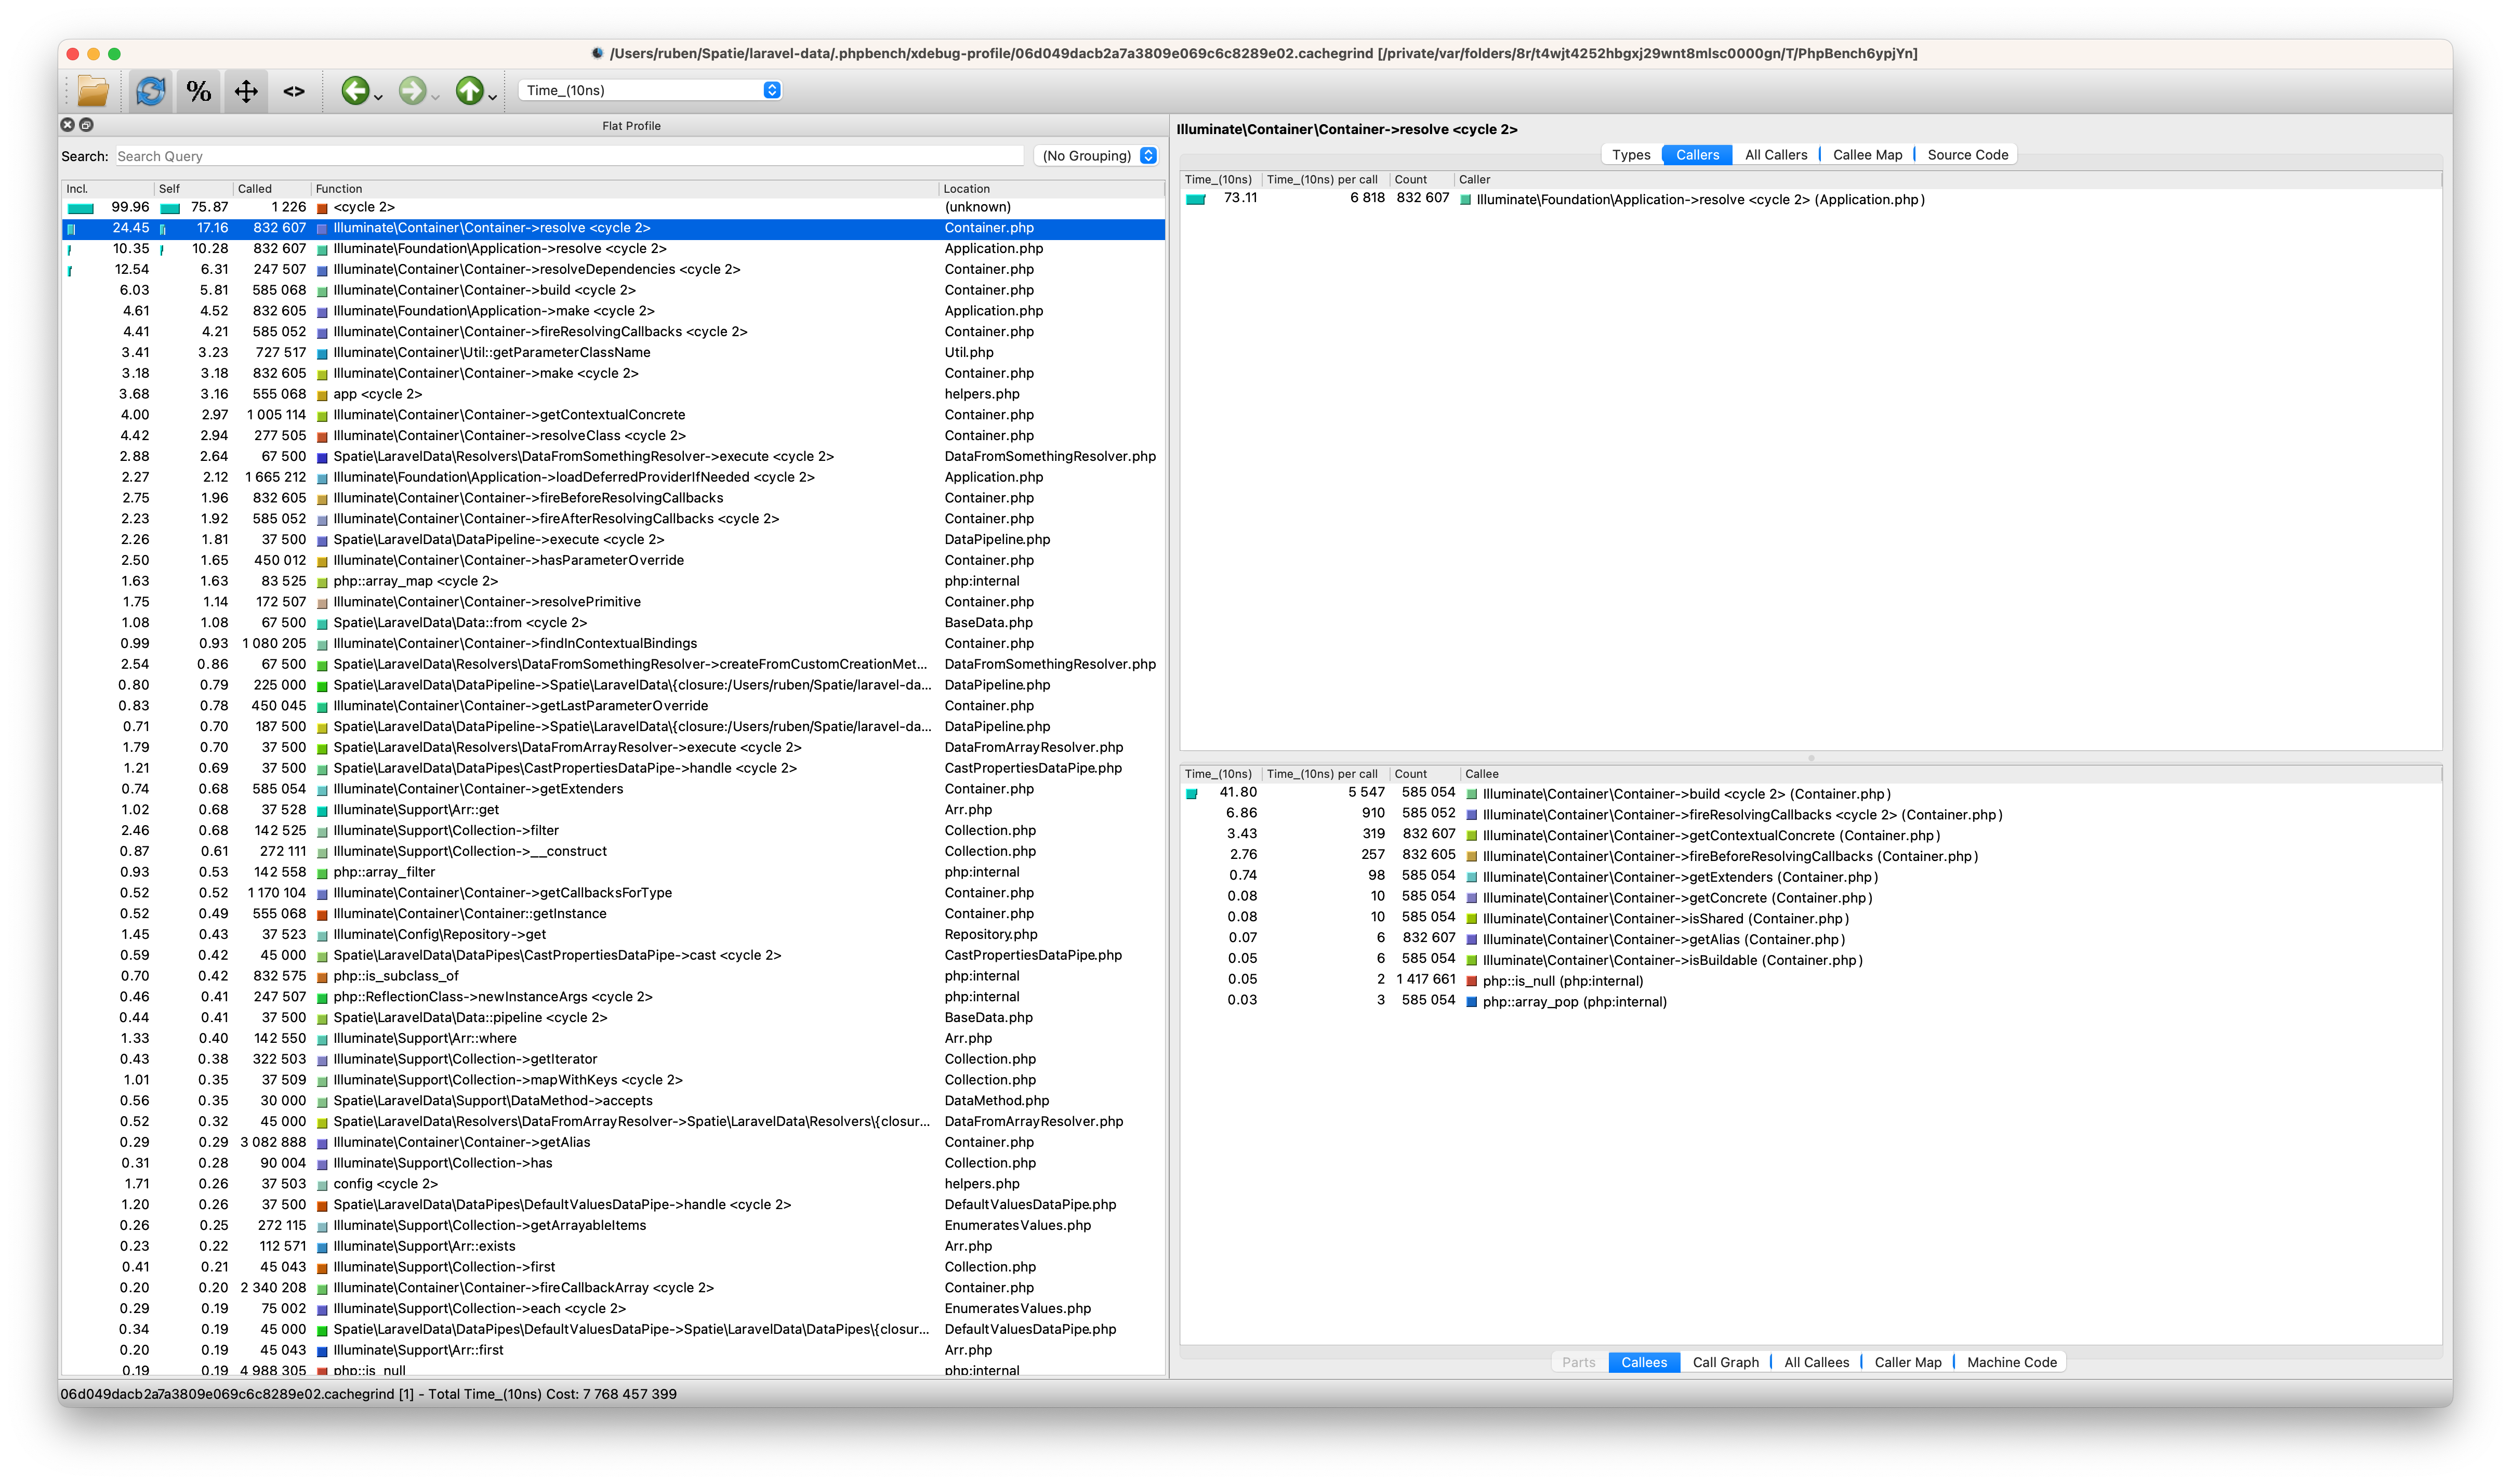
This function has been called by Illuminate\Foundation\Application->resolve(). Let's click on that one. We see Illuminate\Container\Container->make() as the function, usually calling the resolve function. We keep on clicking on the most called functions until we enter the helpers.php file:
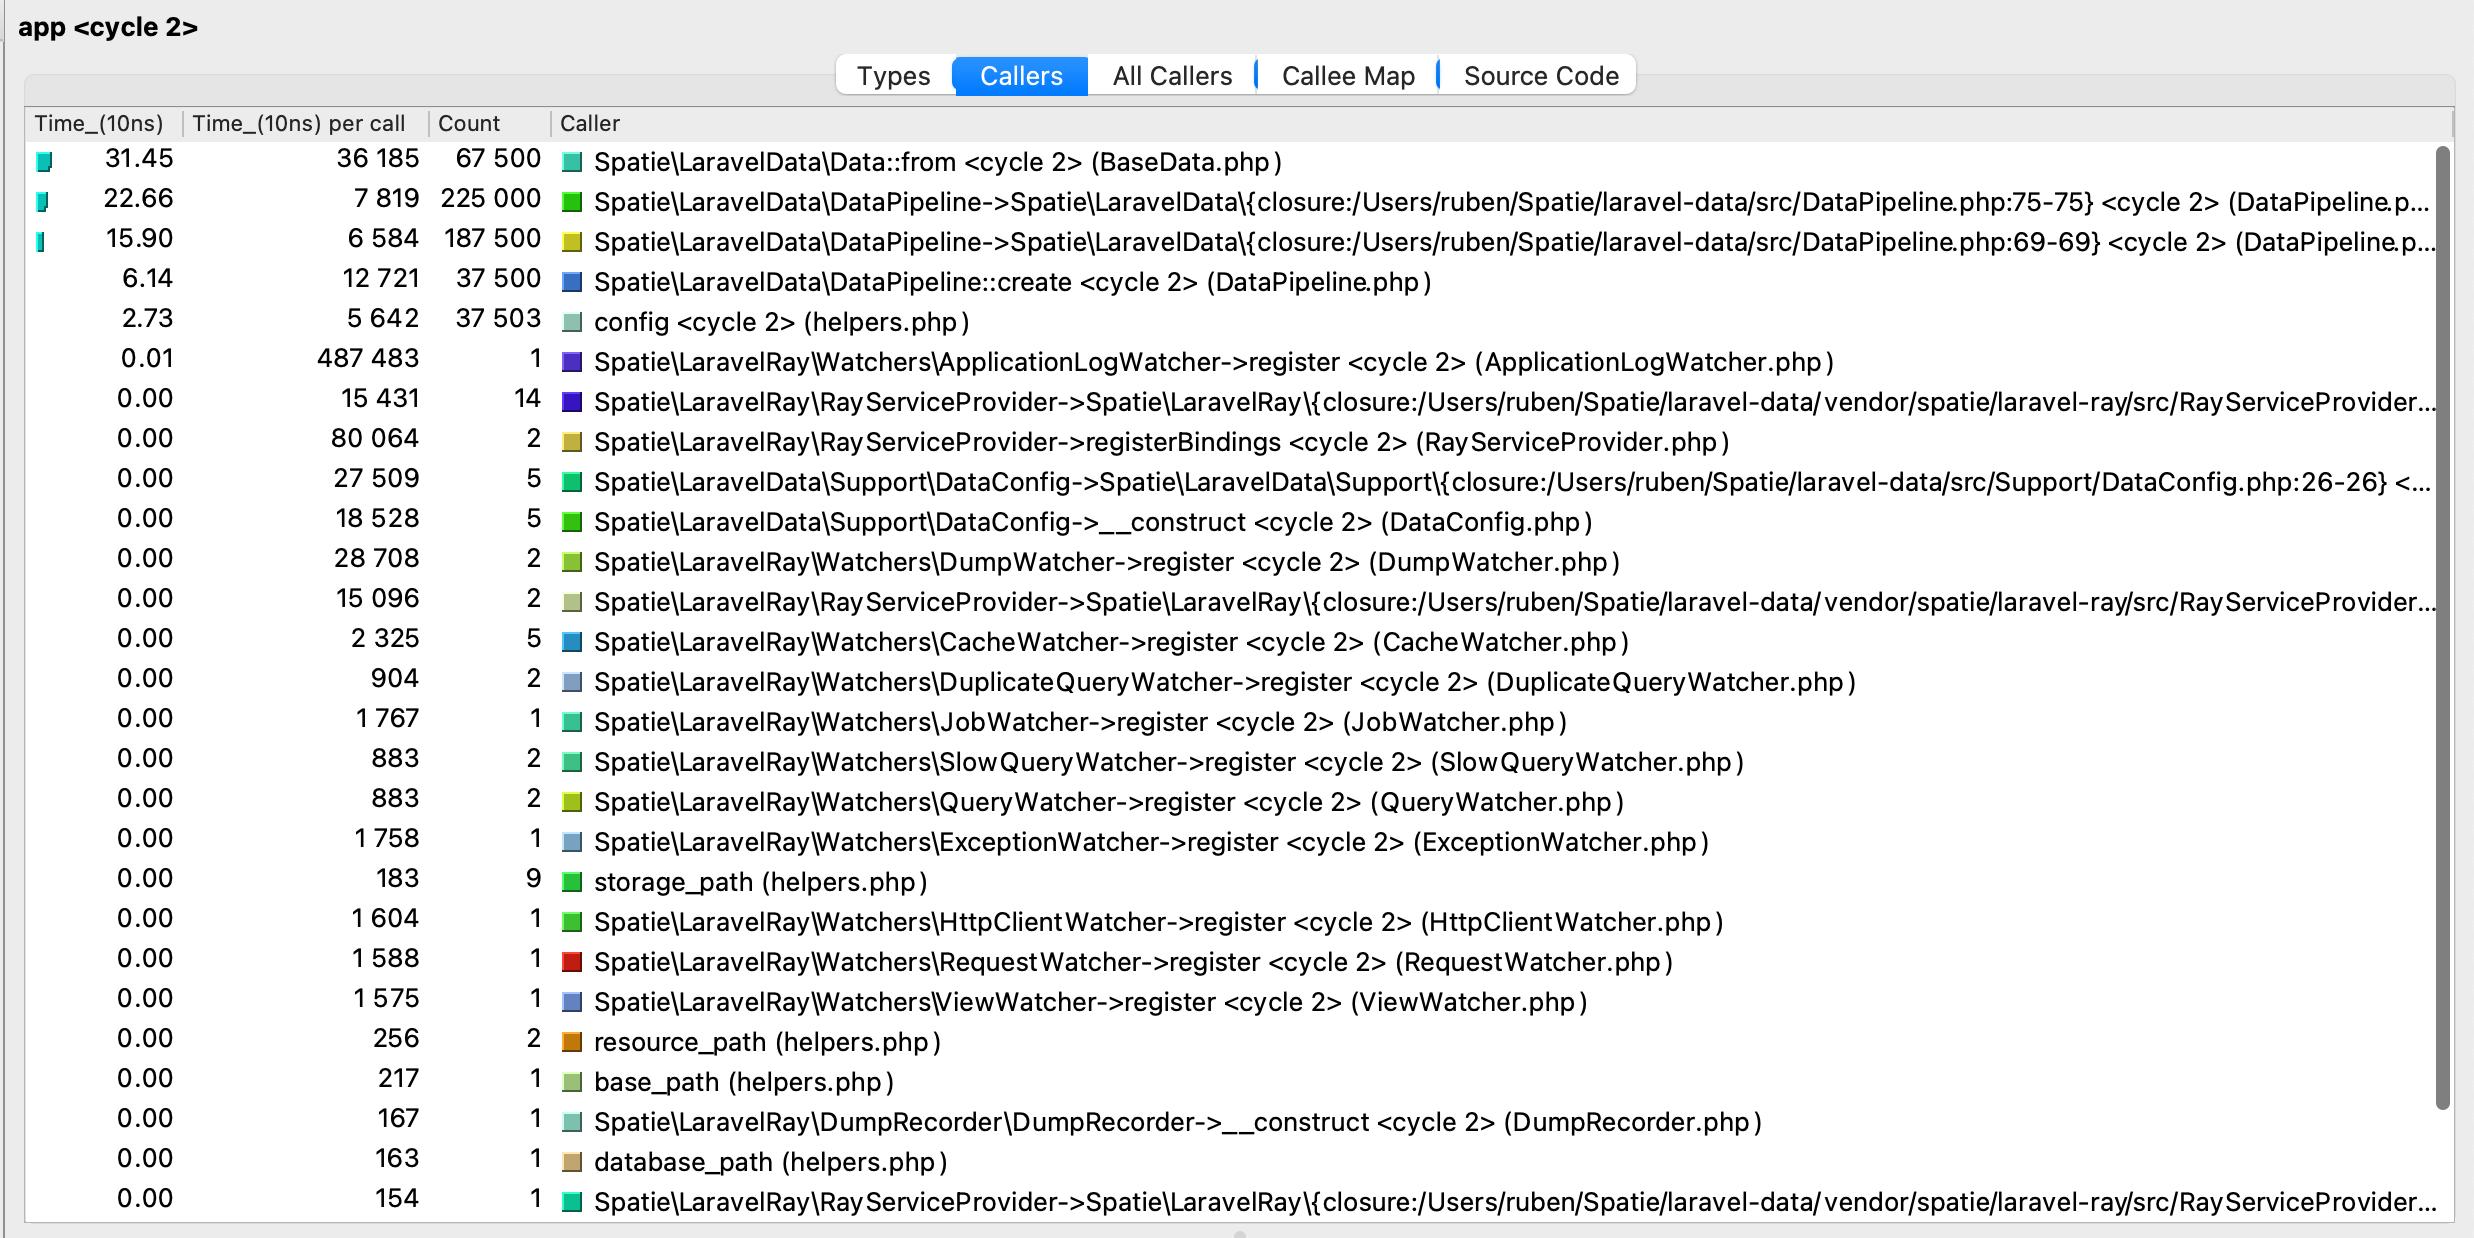
From this data, we can see that we're resolving a lot from the Laravel container:
-
Data::from67500 items -
DataPipeline in a closure (line 75)-> 225000 items -
DataPipeline in a closure (line 69)-> 187500 items
What's exactly happening here? Let's take a look at the DataPipeline code:
public function execute(): Collection
{
    /** @var \Spatie\LaravelData\Normalizers\Normalizer[] $normalizers */
    $normalizers = array_map(
        fn (string|Normalizer $normalizer) => is_string($normalizer) ? app($normalizer) : $normalizer,
        $this->normalizers
    );

    /** @var \Spatie\LaravelData\DataPipes\DataPipe[] $pipes */
    $pipes = array_map(
        fn (string|DataPipe $pipe) => is_string($pipe) ? app($pipe) : $pipe,
        $this->pipes
    );

    // Other code, hidden to keep things a bit easier to read
}
This code doesn't look like a performance problem. Yes, we're creating these normalizers and pipes from the container, but as long as this method isn't being executed that many times there won't be a problem in the end. This process should happen somewhere.
Let's find out from where this code is called:
public function execute(string $class, mixed ...$payloads): BaseData
{
    $properties = new Collection();

    foreach ($payloads as $payload) {
        /** @var BaseData $class */
        $pipeline = $class::pipeline();

        foreach ($class::normalizers() as $normalizer) {
            $pipeline->normalizer($normalizer);
        }

        foreach ($pipeline->using($payload)->execute() as $key => $value) {
            $properties[$key] = $value;
        }
    }

    // Other code, hidden to keep things a bit easier to read
}
That could be better. We create the pipeline for each data object we're constructing, and thus, we resolve all the pipes and normalizers from the container each time. Every time again, this is not required as the pipeline is statically constructed for a data object and thus the same for all objects.
For a few objects, this will be fine. But since we have collections of the same objects (sometimes more than 500), we hit a huge performance problem.
We now cache these pipelines in version 3.2 of laravel-data and add some other performance improvements. This should do a lot for our performance! Finally, let's rerun the benchmarks.
Before performance optimizations:
benchData...............................I1 - Mo293.376μs (±0.79%)
benchDataCollection.....................I1 - Mo5.619ms (±0.48%)
After performance optimizations:
benchData...............................I1 - Mo125.731μs (±0.57%)
benchDataCollection.....................I1 - Mo2.111ms (±0.82%)
For plain data objects, we've improved performance by 57%, and for collections of data, by 62%. That's huge!
In the end
With a few hours of work, we drastically reduced the performance penalty on Flare. Profiling the most critical parts of your application can be valuable, but it is not that easy!
We keep redesigning and refactoring Flare for the next weeks and hope to launch soon! You can find a preview of our new design here. Are you interested in beta testing the new version of Flare? Please send us an email at [email protected]